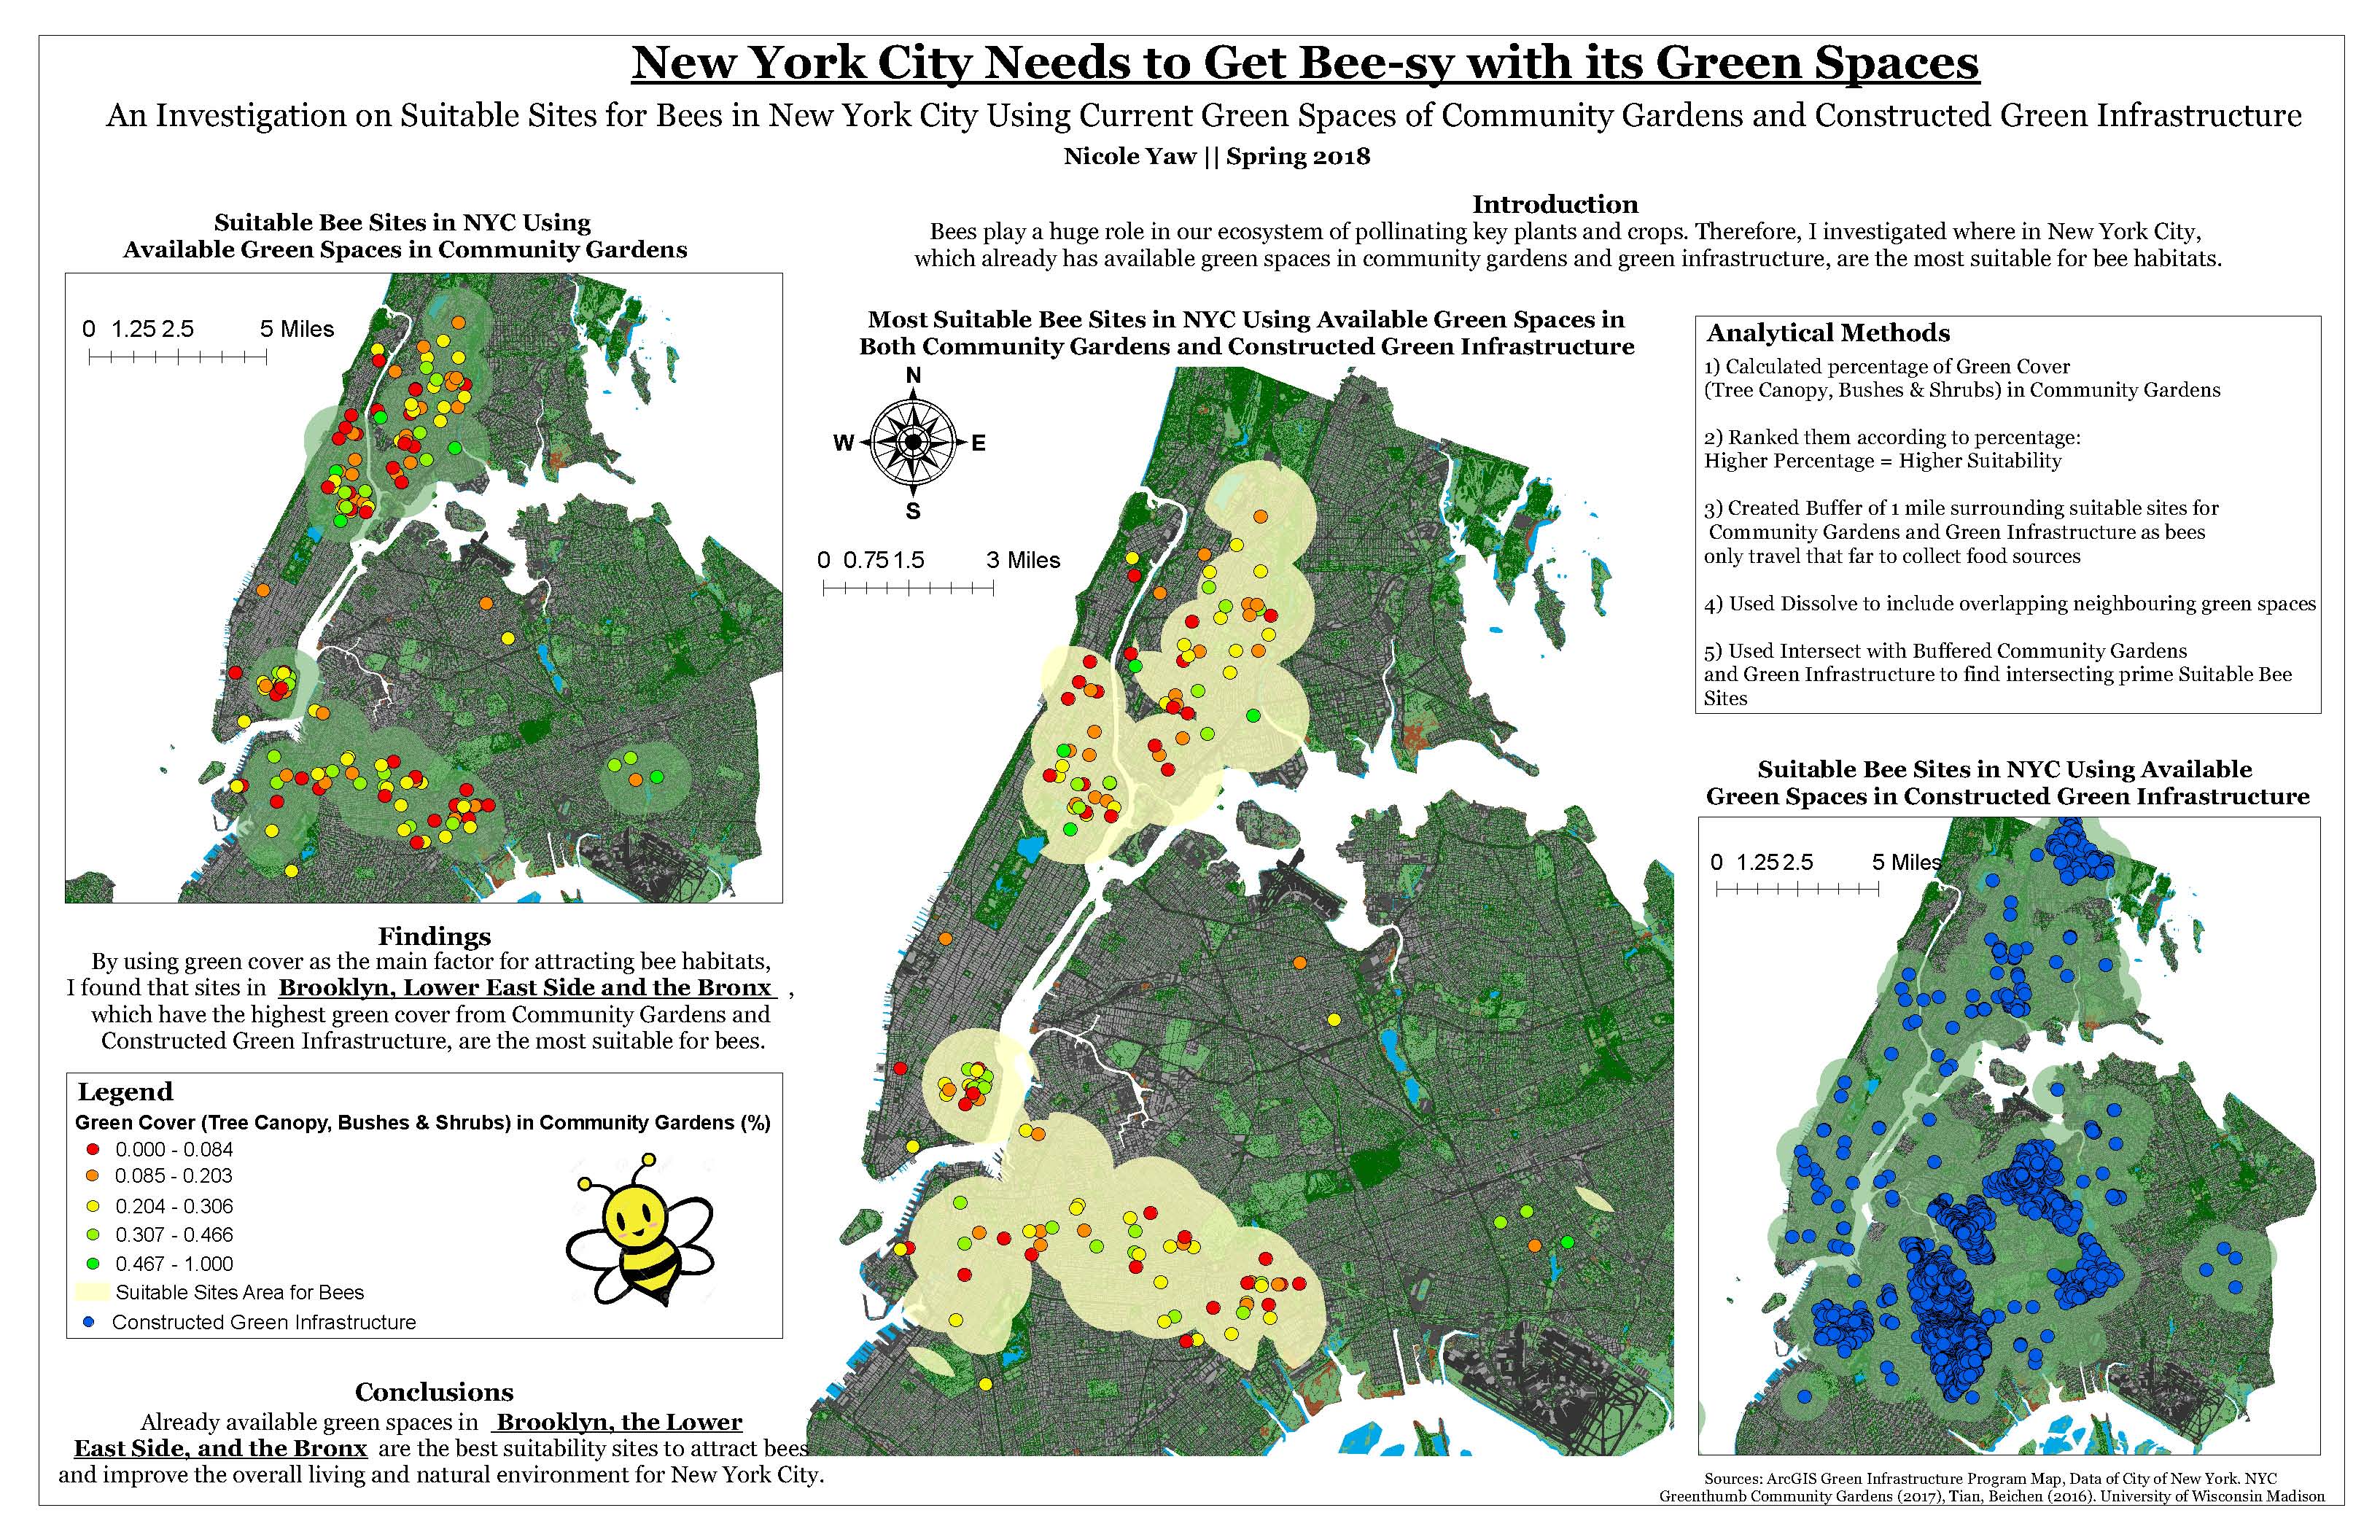
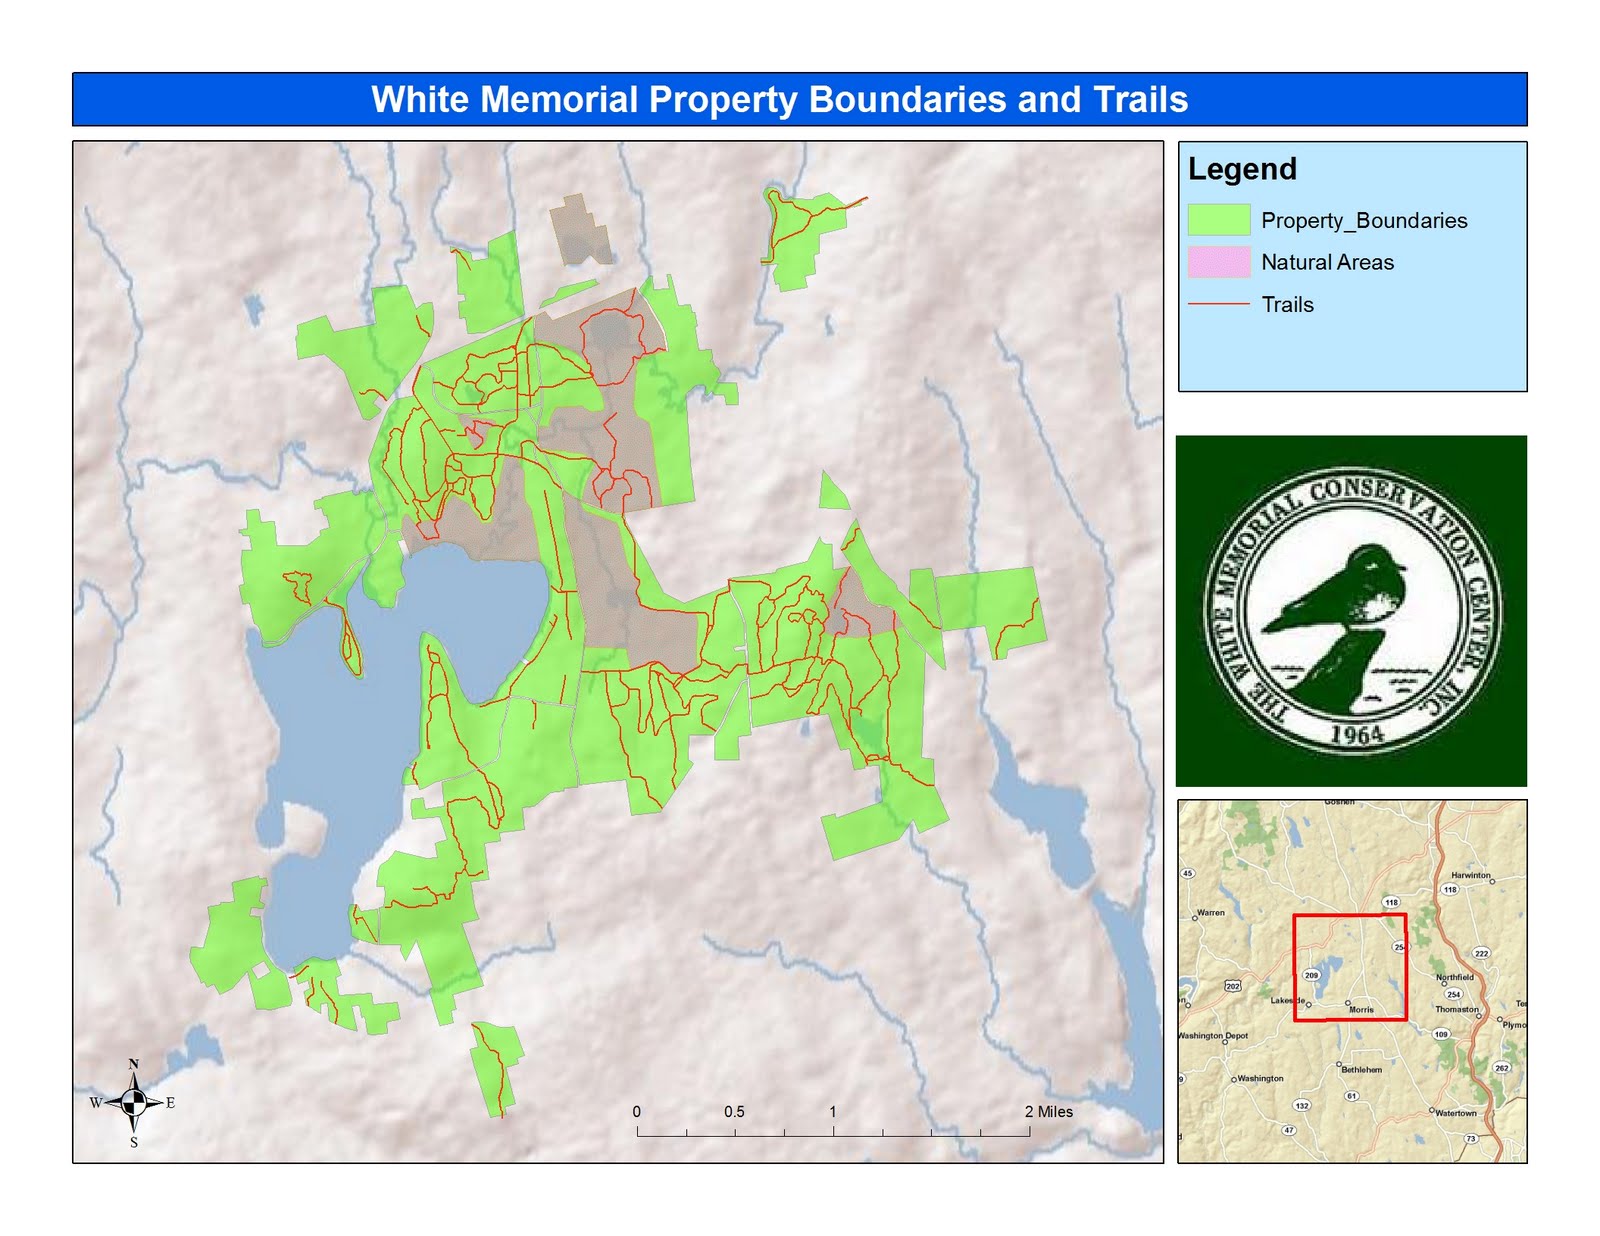
Geographic Information Systems (GIS) have transformed the way we view and analyze spatial data, but they are often misunderstood. Many people equate GIS solely with maps, reducing its vast capabilities to colorful visuals of geographic information. While maps are an essential output of GIS, they represent just a fraction of its potential. GIS is a powerful tool for collecting, analyzing, and interpreting spatial data, enabling smarter decision-making across industries.
GIS, or Geographic Information Systems, is a system designed to capture, store, manipulate, analyze, manage, and present spatial or geographic data. At its core, GIS integrates five critical components: hardware, software, data, people, and methods. Together, these elements enable users to visualize and interpret data to understand relationships, patterns, and trends in a geographic context.
Imagine being able to combine information about traffic, land use, and population density to determine the best location for a new hospital. That’s GIS in action. It turns layers of data into actionable insights, offering solutions to complex problems.
History and Evolution of GIS
The concept of GIS has evolved significantly since its inception in the 1960s. Initially, GIS was used for basic cartography and map digitization. The first known operational GIS was the Canada Geographic Information System, developed in the early 1960s to manage land use data.
By the 1980s, advancements in computing power made GIS more accessible. The introduction of software like ArcGIS and open-source alternatives like QGIS further democratized the technology. Today, GIS is a cornerstone in industries like urban planning, public health, and environmental management, showcasing its growth from simple mapping to an analytical powerhouse.

How Does GIS Work?
Components of a GIS System
GIS operates through a combination of critical components that work seamlessly to process and analyze spatial data:
- Data Collection and Storage: GIS systems gather data from various sources, such as satellite imagery, surveys, and IoT devices. This data can include geographic coordinates, demographic information, or even sensor readings from smart devices.
- Spatial Analysis Tools: GIS employs algorithms to analyze spatial relationships, such as proximity, density, and overlap. For example, it can determine how close schools are to residential areas or identify regions at risk during a flood.
- Visualization and Mapping: While maps are a primary output, they are not the sole purpose of GIS. Maps are one way to visualize spatial data, but tables, charts, and statistical summaries also play key roles in presenting insights.
By combining these elements, GIS transforms raw data into actionable intelligence, helping users make informed decisions.
GIS Data Types
At the heart of GIS are two main types of data: vector data and raster data.
- Vector Data: Represents geographic features as points, lines, and polygons. For instance, a city’s road network can be mapped using lines, and parks can be represented as polygons.
- Raster Data: Consists of grid cells, each assigned a value. This format is used for continuous data like elevation models or satellite imagery.
Additionally, GIS incorporates spatial data (data that defines the location of features) and attribute data (descriptive information about those features). For example, a GIS might show the location of schools (spatial data) and their student capacity (attribute data). This ability to combine spatial and non-spatial data makes GIS unique.
Applications of GIS
GIS has a myriad of applications, with maps often being just one output among many. Here are some examples:
- Urban Planning: GIS helps planners visualize zoning, infrastructure, and population growth patterns to guide sustainable development.
- Environmental Conservation: By analyzing deforestation patterns and species habitats, GIS aids in biodiversity protection.
- Disaster Management: Emergency services use GIS to map flood-prone areas, track hurricanes, and plan evacuation routes.
- Public Health: GIS plays a role in tracking disease outbreaks, such as during the COVID-19 pandemic, to identify hotspots and allocate resources effectively.
Each of these applications highlights the role of GIS in data analysis and decision-making beyond merely producing maps.

Are Maps the Only Output of GIS?
Maps as a Tool, Not the Goal
A common misconception about GIS is that its primary function is to create maps. While maps are a valuable tool for visualizing geographic data, they are just one of many outputs of a GIS. In fact, maps often serve as a stepping stone to more in-depth analysis.
GIS is a platform for understanding spatial relationships and providing insights through data. For instance, instead of merely showing where traffic congestion occurs, GIS can analyze traffic flow patterns, predict future bottlenecks, and suggest alternative routes. Similarly, in environmental studies, GIS doesn’t just map forest cover—it assesses deforestation trends over time and predicts future impacts.
Beyond Maps: The Analytical Power of GIS
The analytical capabilities of GIS are what truly set it apart. Some examples of GIS analysis include:
- Predictive Modeling: GIS uses historical and real-time data to forecast future events. For instance, retailers use GIS to predict foot traffic around a new store location.
- Statistical Analysis: GIS provides detailed statistical outputs, such as population density graphs, resource allocation tables, or climate trend charts.
- 3D Modeling: Urban planners use GIS to create 3D visualizations of cityscapes, enabling better planning of building heights and sunlight access.
- Real-Time Tracking: GIS powers applications like GPS navigation and real-time tracking of delivery vehicles or wildlife movements.
These applications demonstrate how GIS delivers value not just through static maps but also through data-rich insights that guide strategic decisions.
Case Study: GIS in Public Health
During the Ebola outbreak in West Africa, GIS was used to map the spread of the disease. However, the system went beyond mere mapping. It analyzed factors like population density, transportation networks, and healthcare facility locations to predict high-risk areas and optimize resource distribution. The ability to combine spatial and non-spatial data made GIS an indispensable tool in managing the outbreak.
Similarly, during the COVID-19 pandemic, GIS helped governments and organizations track infection hotspots and vaccine distribution. Dashboards like the Johns Hopkins COVID-19 Map became household names, highlighting how GIS contributes far beyond static cartography.

Differences Between GIS and Traditional Cartography
GIS vs. Static Maps
Traditional cartography focuses on creating static, two-dimensional maps to represent geographic features. These maps are designed for specific purposes, such as navigation or historical documentation, and once printed or produced, they do not change. In contrast, GIS is a dynamic and interactive tool that can update and adapt as new data becomes available.
Here are some key distinctions between GIS and static maps:
| Feature | Traditional Maps | GIS |
|---|---|---|
| Data Integration | Limited to visual representation | Combines multiple datasets for analysis |
| Interactivity | Static, non-interactive | Dynamic and user-interactive |
| Data Updates | Requires re-creation | Easily updated with new data |
| Analysis | Minimal or none | Advanced spatial and statistical analysis |
For example, a traditional map of a city’s bus routes may show fixed routes and stops, while a GIS application can analyze real-time bus movements, identify delays, and predict traffic patterns.
Analytical Capabilities of GIS
What sets GIS apart is its ability to go beyond visualization and enable spatial analysis. This includes tasks like:
- Overlay Analysis: Combining multiple data layers, such as soil type and rainfall, to identify suitable agricultural zones.
- Proximity Analysis: Determining the distance of emergency facilities (hospitals, fire stations) from populated areas.
- Heat Mapping: Visualizing areas with high activity, such as crime hotspots or retail sales.
These tools empower users to not only visualize geographic phenomena but also derive actionable insights. For instance, law enforcement agencies use GIS to allocate resources based on crime density maps, ensuring a data-driven approach to public safety.
Real-World Example: GIS in Environmental Management
In California, GIS is used to monitor and mitigate the effects of wildfires. While traditional maps may depict areas prone to wildfires, GIS allows fire management teams to analyze factors such as wind direction, vegetation type, and humidity levels in real time. This information helps firefighters prioritize high-risk areas and allocate resources effectively, reducing potential damage and saving lives.